Where to Find Chart Marking Tutorials for Stock Trading | Mentor Aditya Jain Academy
Updated: Oct 10
Most traders fail not because they can’t analyze the market —
but because they don’t know how to mark their charts properly.
Chart marking is the foundation of every professional trader’s decision-making process.
If you’re searching for where to learn it correctly, this guide by Mentor Aditya Jain Academy will show you exactly what to follow.
About this guide: it's written by the Mentor Aditya Jain Academy team in Jaipur to explain what chart marking is and where to learn it. It isn't advice to buy or sell anything, and we don't give tips or buy and sell calls.
📈 What Is Chart Marking in Stock Trading?
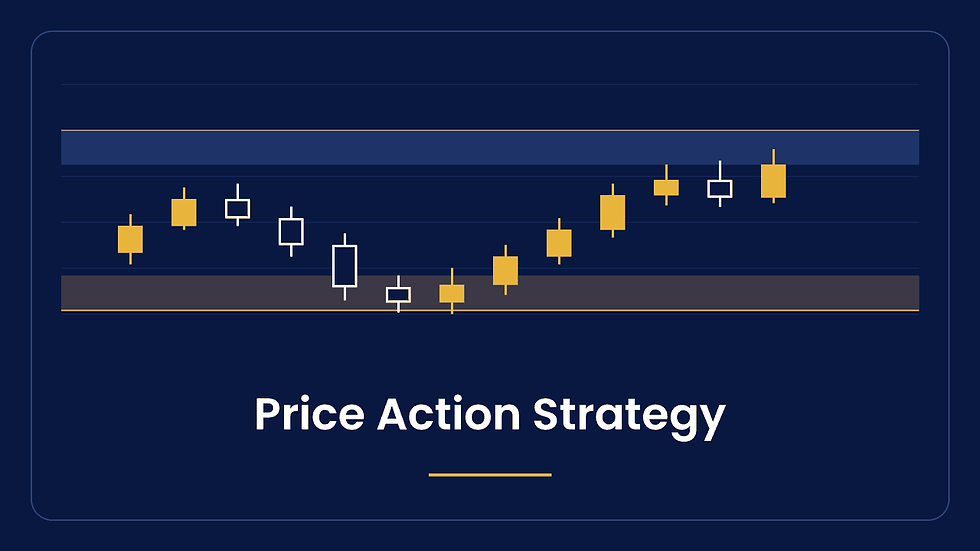
Chart marking means identifying key market zones — where institutions buy and sell.
It’s not about drawing random trend lines.
It’s about understanding price psychology, liquidity points, and reaction levels.
At Mentor Aditya Jain Academy, students learn how to mark charts the same way FIIs and institutional traders do.
🧠 Why Chart Marking Matters
Creates Trading Structure: You see trades before they happen.
Removes Confusion: No more guessing buy/sell points.
Shows Institutional Logic: Learn how big money moves.
Improves Risk Control: Identify invalidation zones with precision.
Without chart marking, every trade becomes gambling.
🧩 Types of Chart Marking You’ll Learn
1️⃣ Supply & Demand Zones – Learn where institutions create liquidity traps.
2️⃣ Break of Structure (BOS) – Understand trend shifts with clarity.
3️⃣ Liquidity Sweep Zones – Recognize false breakouts.
4️⃣ FVG & Imbalance Areas – Identify where price is likely to return.
5️⃣ Entry Models with Risk Control – Learn how to plan trades before execution.
🏛 Where to Find the Best Tutorials
You’ll find hundreds of chart marking videos on YouTube —
but very few explain the “why” behind each line.
At Mentor Aditya Jain Academy, every chart marking tutorial is:
Based on Institutional Logic, not random drawing
Backed by AI-based chart analysis tools
Taught by Mentor Aditya Jain
Includes live chart marking sessions with real examples
If you want to master complete institutional chart marking and trade planning, join our flagship Global Stock Market Course with AI (Fee: ₹14,999) – this is our main paid program for serious traders.
If you are a complete beginner, start with our Free Stock Market Course (Fee: ₹0) to build your foundation before entering advanced concepts.
💬 Real Student Feedback Videos & Photos.
“After learning chart marking from Mentor Aditya Jain Sir, I finally understood why I lost trades earlier.”— Ravi S., Bangalore
🏆 Why Choose Mentor Aditya Jain Academy
Structured chart marking lessons with live sessions and recordings
Mentorship that focuses on practical chart experience
Students from across India
Students across India learn stock market, commodity and cryptocurrency trading with Mentor Aditya Jain Academy
📞 Toll-Free Support: 1800-202-8034 & 063-5033-9545
Personal Guidance Desk on WhatsApp
A real person on our Personal Guidance Desk answers chats on the official WhatsApp (063-5033-9545), with no pressure to join. We respect your privacy. We never make spam or follow-up calls. If you prefer, call us on toll-free 1800-202-8034 or chat on WhatsApp 063-5033-9545. If you'd like help understanding chart marking, message our Personal Guidance Desk on WhatsApp.
FAQs
Q1. What is chart marking in stock trading?
Chart marking means identifying key price levels based on institutional logic, not random indicators.
Q2. Can beginners learn chart marking?
Yes. Mentor Aditya Jain Academy starts from basics and builds to advanced institutional structures.
Q3. Are your tutorials live or recorded?
Both. Students get access to recorded tutorials plus live mentorship sessions.
Q4. Do I need software for chart marking?
No. You can start with free platforms like TradingView — our tutorials guide you step-by-step.